While climate diplomats and campaigners flock to Belém for COP30, capital and technology are moving faster than the negotiations. The energy transition is already unfolding in capital markets and at construction sites, from São Paulo to Sweden to Singapore.
For too long, the story of climate tech has been told through a Silicon Valley and Washington, D.C. lens. But that was never the whole picture. A year into Trump 2.0, we’re zooming out to see how the transition is playing out across continents, fueled by shifting centers of capital, policy, and innovation.
At Sightline, we wanted to map the vast scope and diversity of climate tech around the world, not just to see what’s changing as US federal funding pulls back, but to spotlight global innovations, deployment, and the factors enabling them (or holding them back). The result is our new Globalization of Climate Tech report, in partnership with HSBC: a 60-page, data-backed look at where climate capital is flowing, what’s driving deployment, and which regions are taking the lead.
You can also join us Thursday, November 13, at 9 AM GMT, for a live discussion of the Globalization Report. This webinar will dive into VC investment, project development, and policy trends shaping climate tech in Europe and emerging markets, and explore where the next wave of deployment is headed. Featuring Julia Attwood (Sightline Research Director), Kim Zou (Sightline Co-Founder & CEO), and Thomas Miles (Senior Manager of Climate Tech, HSBC).
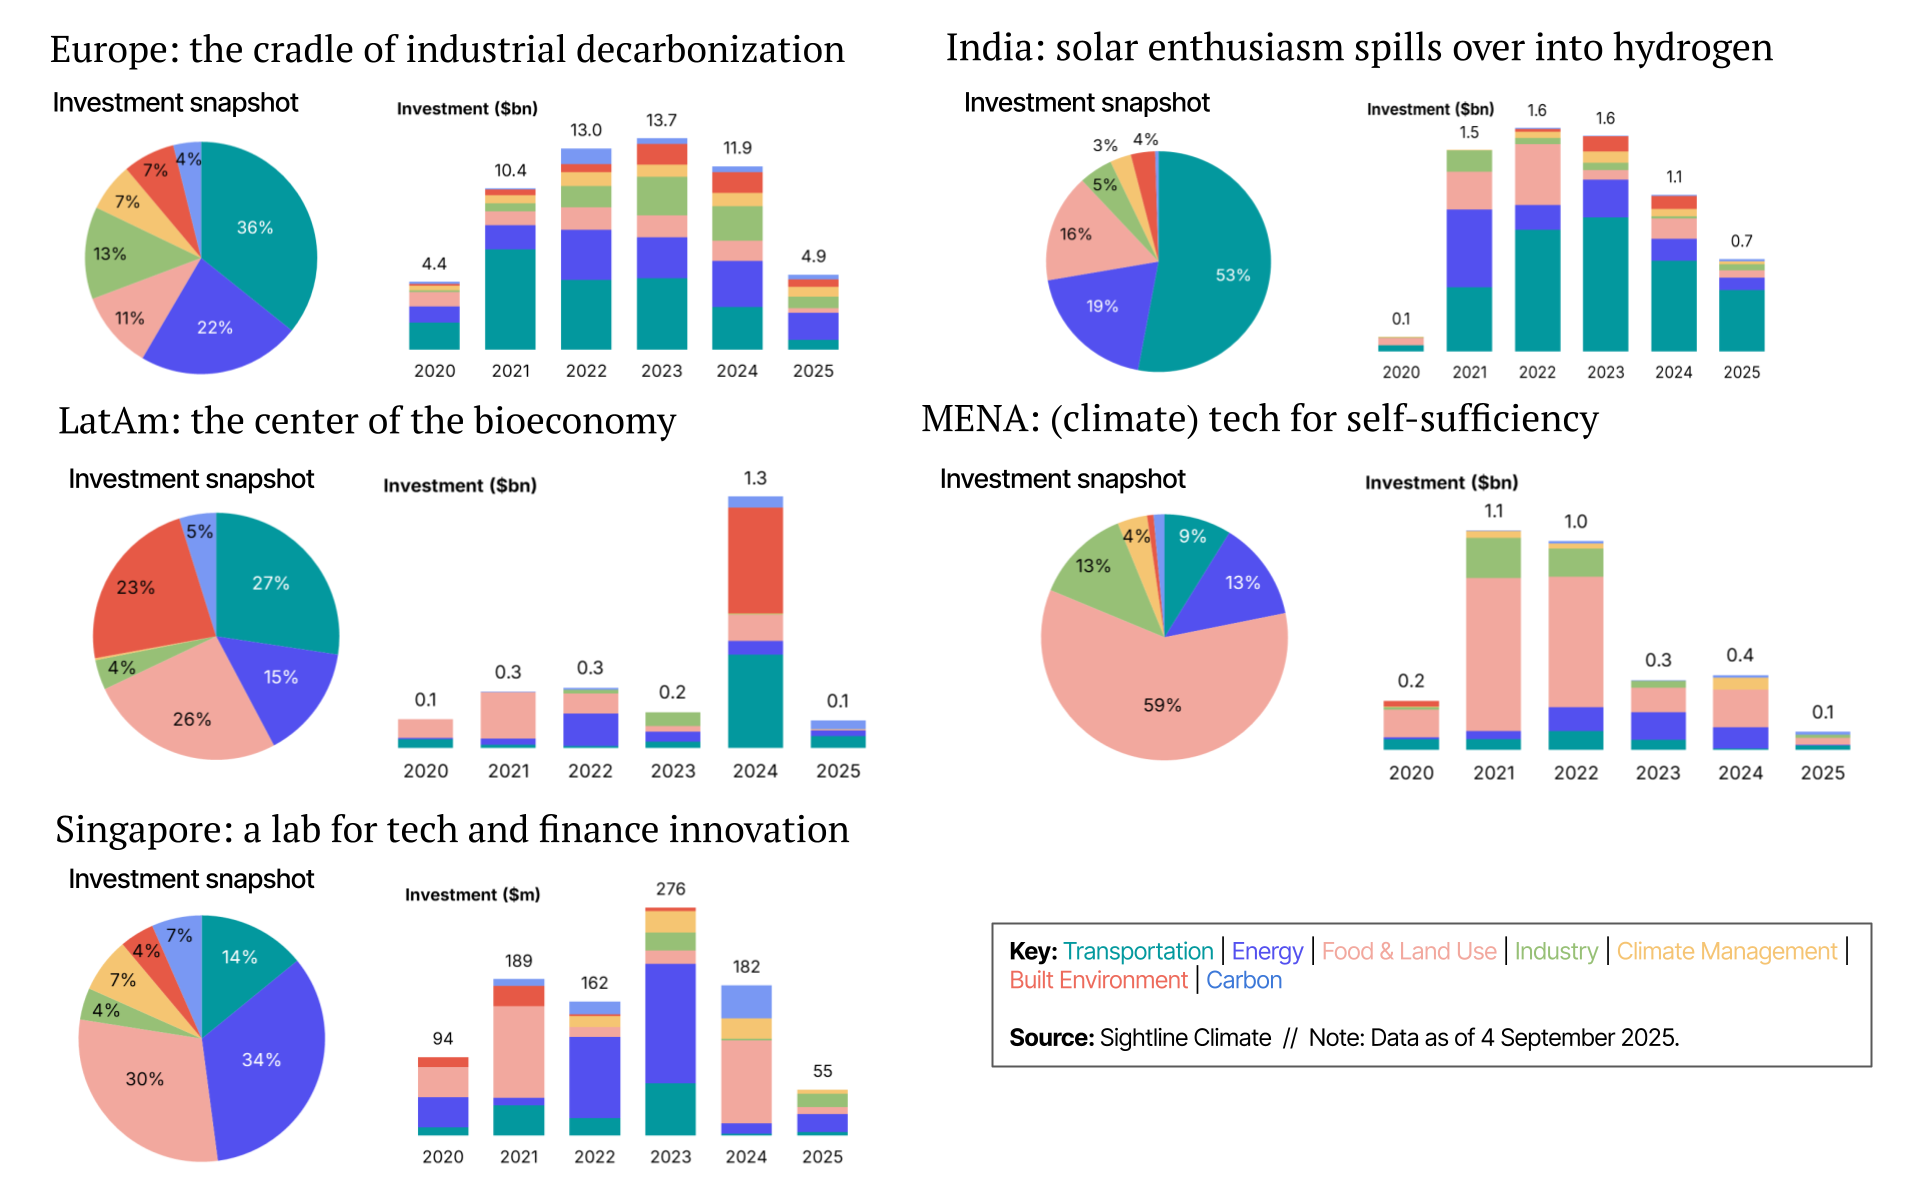
The report focuses on key areas: Europe is the most obvious contender to the US in terms of climate tech, and is leading in many sectors for project deployment. But there's a long tail of leaders-in-waiting. We chose India, MENA, LatAm, and Singapore, as they've all shown momentum in climate tech in the past few years and received similar levels of investment. For project deployment, we chose sectors with a diverse pipeline to give a representative view across the key verticals we track, industry (ammonia, cement), energy (LDES, nuclear), carbon (gas+CCS), and transportation (SAF).
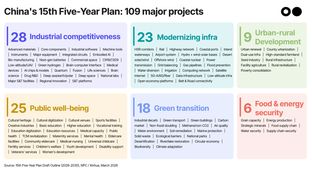
China is the elephant in the room — its scale and influence warrant a report of their own. We’ll be fast-following with dedicated analysis on China’s role in global climate tech and the transition economy.
Key takeaways
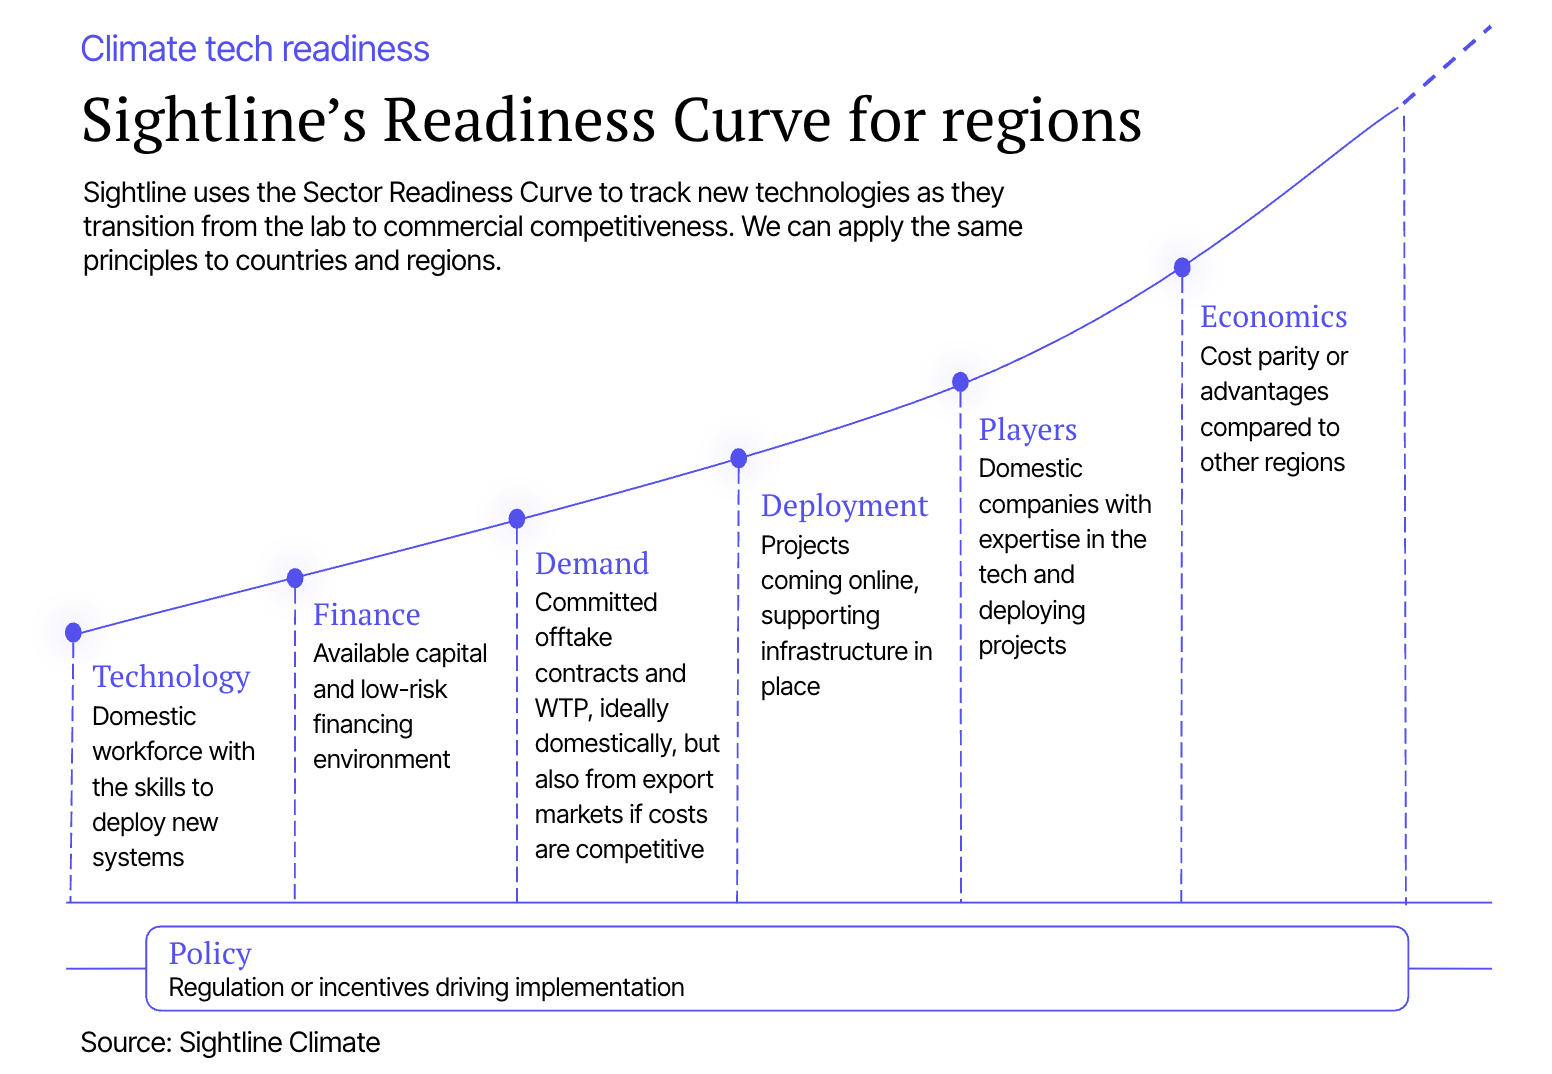
Climate tech scale shows up in two ways: VC demonstrates innovation, projects demonstrate scale. A strong pipeline of projects under construction or operation signals that a region has solved infrastructure, finance, and permitting challenges; stalled capacity signals the opposite. Sightline identifies six factors that determine where technology scales — Technology, Finance, Demand, Deployment, Players, and Economics — each reliant on the right policy base.
Where we are: The US still leads in VC, but Europe is closing the gap, raising $13.7bn to the US’s $15.8bn in 2023 and staying stable as US investment dipped. Massive public funding outside the US could accelerate others: the EIB’s €1tn, India’s $2bn Hydrogen Mission, Singapore’s $3.9bn Future Energy Fund, and Saudi Arabia’s $500bn NEOM. Project development is now shifting toward Europe and emerging markets, driven by faster permitting, cheaper feedstocks, and scale potential. If you're chasing subsidies, you're probably looking at the EU, but developing economies have the low-cost resources to compete for export markets.
What’s next: Emerging markets are managing growth better. Building on their momentum of building everything else for their populations, regions like India and LatAm have shown a greater willingness to quickly address issues like grid congestion that the US and Europe continue to struggle with. Climate targets in these regions are equally ambitious, and, if maintained, could see them outpace more developed economies. It's not just emissions. LatAm, MENA, India, and Singapore are all expecting climate tech to deliver them quality of life improvements, resiliency, circularity, or security, in addition to lower CO2. And that will shape investment strategies and deployment.
The report has the full funding numbers, sector project deployment numbers, region policy profiles, and more. You can get the full report here, or read on for more.
The foundation: Sightline research and data
Sightline combines investment and project data with expert analysis to show how decarbonization, new industrial strategies, and shifting geopolitics are reshaping global climate investment and deployment. This report draws on economic data, policy insights, and case studies to map how climate tech sectors are scaling worldwide, and the factors enabling (or hindering) their growth.
We assessed this along Sightline’s Readiness Curve: the six factors that determine where and how technology scales: Technology, Finance, Demand, Deployment, Players, and Economics. Each depends on the right policy foundation to move forward.
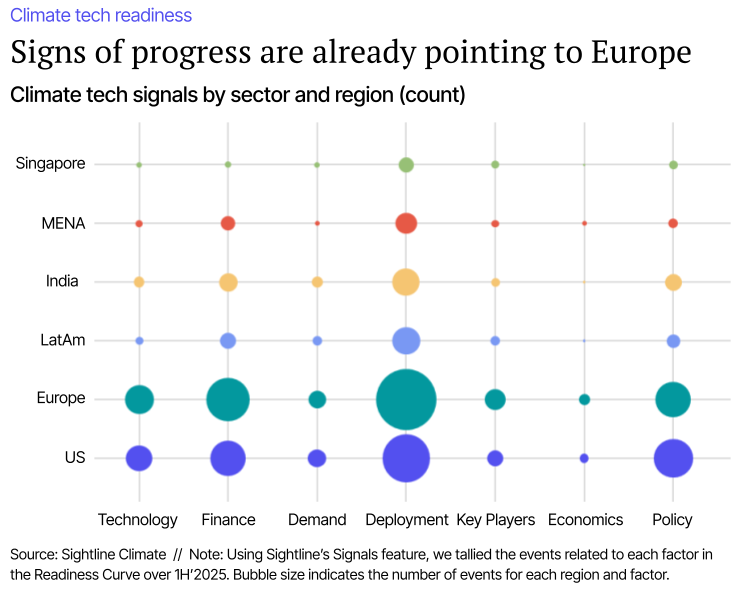
One tool on the Sightline platform is Signals, an AI-powered feed tracking key market events across Sightline's energy and climate taxonomy and readiness categories, in real time. We mapped the momentum of Signals by region. [Clients can access Signals here.]
In every category except demand and policy, Europe beat the US. And even demand was very close, with just 10% between them. As a mature market with good policy support and an existing (if more conservative) venture community, investors and project developers alike are focusing their attention on Europe.
But each region has unique characteristics that make them poised to scale, if they can capitalize on them. You’ll see throughout the report how different regions are building capital flows, unlocking projects, and building domestic markets.
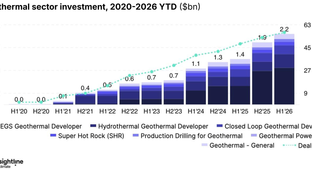
Source: Sightline Climate // Note: Data for 2025 is up to 4 September 2025. For values by series, data is from 1 January 2020 - 4 September 2025.
It’s hard to beat the US’s climate capital stack, but Europe competes. While global VC funding fell in 2023–24, US investment rose 2% and is on track to climb another 16% in 2025, a sign of its deep capital base and investors’ appetite for big checks. Many startups are keeping US headquarters while building FOAK projects abroad, taking advantage of both funding and lower deployment costs. Mega deals continue to prop up the market, with most major rounds still led by US firms, even as deal counts stay close to Europe’s.
Yet when it comes to exits, India is stealing the spotlight: In 2024 and 2025, it logged more IPOs than the US and Europe combined, driven by mature micro-mobility and renewables players. SPACs briefly gave the US an edge, but their post-2021 decline shows that India’s growth story is the one to watch.
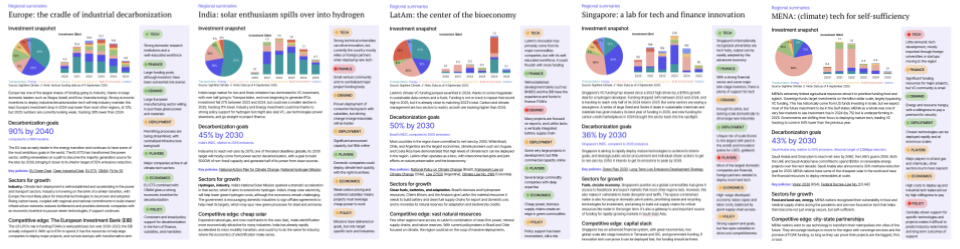
Learn more: Regional snapshots
Regional readiness, global scale. The report’s dashboards visualize regional investment, sector readiness, and progress toward 1.5 °C alignment. Policy and cooperation scorecards reveal growth opportunities and competitive edges, showing how regions are thinking global but acting local, where policy, industry, and capital now converge.
Source: Sightline Climate // Note: Data for 2025 is up to 1 September 2025.
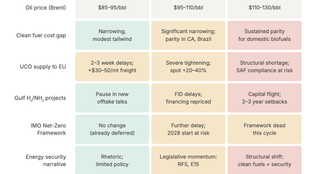
Regional dynamics along the sector readiness curve categories decide which projects become real. Economics hinge on labor and feedstock costs; regulation shapes timelines; and domestic demand determines whether projects must export and compete abroad. Policy can offset some of these barriers — Europe’s procurement rules and CBAM, for instance — while others play to existing strengths, as Latin America does through its bioeconomy built on agriculture.
Most of today’s project pipeline was announced before the “energy security” pivot. The IRA and CBAM sparked a boom as developers rushed to capture subsidies and export access. But much of that capacity remains unbuilt and subsidy-dependent. With incentives tightening, new project announcements are likely to slow.
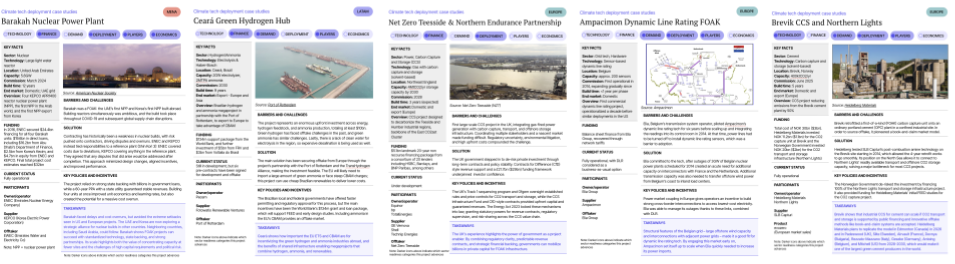
Learn more: Project case studies
Spotlight on global deployment. Case studies show how regions scale climate tech differently: Europe’s Brevik CCS and Northern Lights prove how public finance can de-risk first-of-a-kind projects; India’s Kudgi Liquid CO₂ Storage uses domestic manufacturing to cut LDES costs; MENA’s Barakah Nuclear Plant shows how state capital can export standardized nuclear tech; LatAm’s Ceará Green Hydrogen Hub secures demand through EU CBAM-linked offtakes; and Singapore’s Neste SAF Refinery leverages trade and feedstock advantages to lead in sustainable aviation fuel.
Innovation moves east. Asia dominates electrolyzers and batteries but now wants to create new tech, not just manufacture everyone else’s; Europe can become the host of choice for industrial FOAKs with strong policy incentives.
Emissions are not enough on their own. Emerging economies are embracing climate tech not only to meet climate targets, but because they expect it to deliver quality of life improvements, resilience, and revenues.
Emerging markets are becoming climate tech exporters, and can deliver lower costs. Their scale and feedstock advantages make them central to global decarbonization supply chains. The promise of premium exports are keeping green commodity projects in the pipeline.
Investors can’t afford to think regionally. The most successful capital allocators will follow readiness, not borders. Startups will chase incentives and demand for their FOAKs, and won’t be limited to their home markets.
Join us for a free webinar Thursday, November 13, to learn more about the data and trends driving globalization. If you can't attend, register and we'll send you the recording afterwards.


 Newsletter