🌍 Rise of the robots, NY Tech Week edition
What happens when climate tech meets robotics
(Bonus edition) Part III: The software “middleware” layer for grid operators / utilities
Here’s a special bonus to share our gratitude. Last week, we unscrewed the nuts and bolts of grid tech hardware, so this week we’re decoding the bits and bytes of grid tech software. Read last week’s post? Skip to the Market Map section to jump right back in.
The grid serves as the underlying infrastructure for the climate transition — tethering us all via overhead and underground wire and fiber. For a 2050 net-zero future, we’ll need an electricity grid large enough that its untangled cables would be long enough to stretch all the way to the sun. To get there, the grid requires constant attention to balance the flow of electrons. Ensuring grid reliability, resilience, and security is a balancing act between assets, systems, and participants. As electricity demand rises to meet population growth and the electrification transition, so does the need to expand and strengthen the grid.
To quantify that growth requirement, the International Energy Agency (IEA) pegged the gap at 80 million kilometers of new power lines that will have to be built or upgraded globally by 2040. And power lines are just the rails — not to mention all of the accompanying hardware, software, and services that create a reliable, resilient, clean, and accessible grid.
If reaching net zero means electrifying everything, investment in grid tech will be crucial. Accordingly, this year we’ve seen an uptick in public and private interest. In the US, for example, the Department of Energy (DOE) announced $3.5B for grid upgrades as part of the Grid Resilience and Innovation Program (GRIP).
While the grid serves as the underlying infrastructure, the power markets keep the entire operation humming by performing two key functions. First, they use price signals to influence market behavior, just like other commodity markets. Second, they act as a matchmaker between electricity buyers and sellers in order to balance the flow of electrons in real time.
This balance is reflected as two layers:
Physical layer: The underlying infrastructure that allows electricity to flow from generation to end use. This is the equipment, systems, and structures including transmission lines, distribution lines, transformers, and substation equipment.
Digital layer: The data, analytics, and digital processes that allow for the pricing, management, and operation of the grid. In most cases, the electrons sold to you from a residential solar roof won’t be the same ones that you’ll receive. It’s a transaction in the digital layer that represents this movement.
Here, we’ll focus on the digital layer — and more specifically, grid software and services. We’ll walk you through the Sector Compass, how the market works, the key technologies and players, and what to take away.
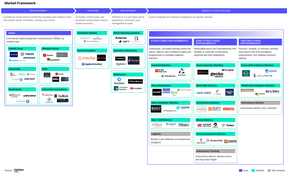
Market Framework: A quick tour
The grid follows a four-step value chain. Whereas the power markets followed a fairly linear operation in the past, a more digital, distributed, and decarbonized grid creates a more complex and sometimes circular set of flows. As demonstrated by the bi-directional arrows, power doesn’t necessarily have to flow from generation straight to end use.
As residential, commercial, and industrial customers install distributed energy resources (DERs), or build virtual power plants (VPPs) or microgrids, they transition from being continuous power consumers to more flexible sources of power demand and, in some cases, even power generators themselves. But how do grid operators know how to work with this additional flexibility and generation and pull these capabilities into the grid? On the market framework diagram, this is highlighted by a Data arrow that feeds back into the Interconnection stage. This data exchange allows end-users with on-site flexible demand, generation, and storage capabilities to offer ancillary and grid flexibility services [read more about grid services in our power markets explainer].
Grids face challenges specific to each step in the value chain.
Generation: Utilities, independent power producers (IPPs), and others generate electrons from fossil, nuclear and renewable sources.
Transmission: Power is sent from power plants over long-distance, high-voltage lines to substations, where the voltage is stepped-down to go through the distribution network.
Distribution: Utilities move power from substations to end users across shorter distances at lower voltages.
End use: Residential, commercial, and industrial consumers use power for various applications.
The grid is becoming more complex than ever. This complexity is characterized by the proliferation of physical assets like power lines, transformers, and substation equipment, the need to leverage the build-out of renewable capacity, and the call for a flexible grid to cope with increased participation.
Operators / utilities have long employed software and associated services to ensure control and visibility over power flows on the grid. And the software employed worked great when power flowed only one-way. But legacy solutions like Supervisory Control and Data Acquisition (SCADA) and Wide Area Monitoring Systems (WAMS) are one-dimensional and fail to manage the complexity of today’s grid.
This is where next generation grid software and services come in. They help operators / utilities achieve greater control and visibility over the grid, by building situational awareness across all assets and systems. Think of these technologies and services as offering an operating system or “middleware” layer for operators / utilities to manage power flows, operations, and planning.
Here, we’ll walk through some of these key technologies and who is pushing the state-of-the-art forward.
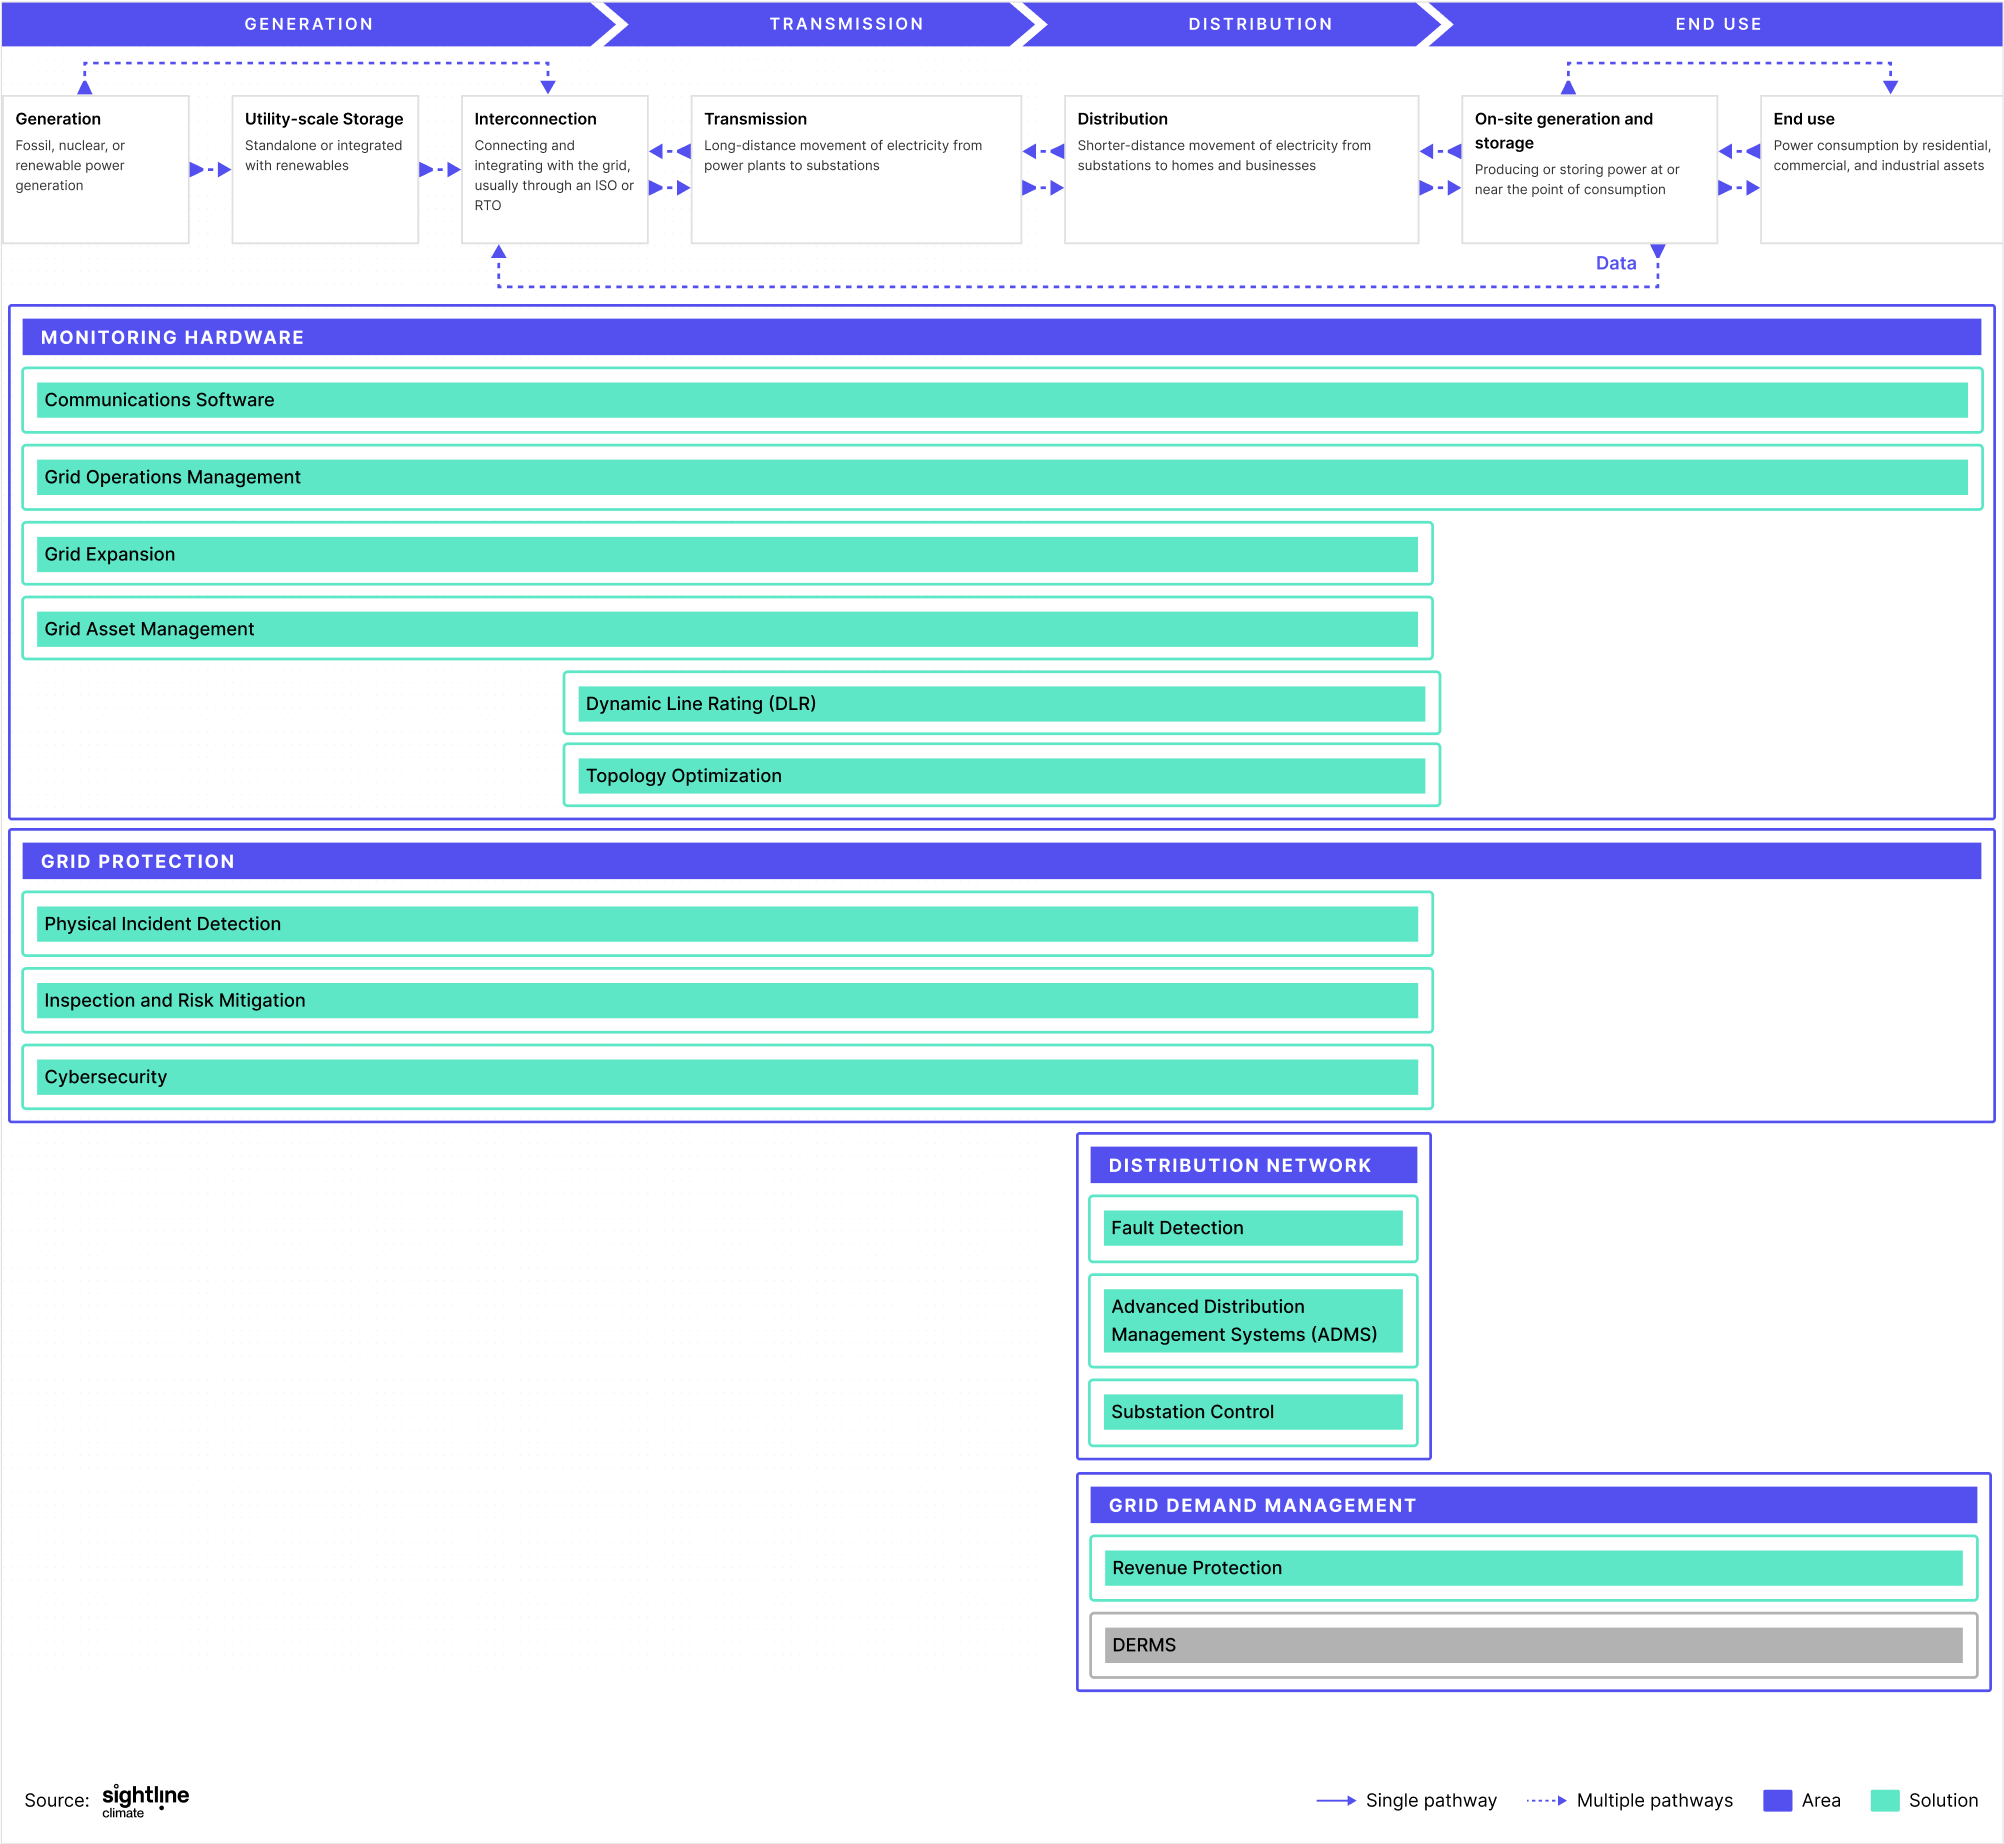
Market Map: Who's doing what
Building new capacity (i.e. power lines and generation interconnections) is onerous. Permitting times are long and difficulties arise from managing NIMBYism, securing Right-of-Way (ROW) agreements, and working with multiple stakeholders. Operators / utilities historically have had limited visibility or assurance on whether new installations would succeed. But what if they could maximize their chances of success from the get-go?
Grid expansion software offers visualization, simulation, and digital modeling tools for new grid project planning. This suite of tools offers a predictive intelligence layer, allowing for the design and validation of new grid installations without laying a single line or pole.
With this visibility, operators / utilities can actively reduce risk for potential grid projects and carry out initial evaluations on costs and potential bottlenecks. Such software offers multiple teams (across operators, utilities, and EPCs) and stakeholders a chance to collaborate on grid expansion plans, breaking silos between teams and providing a unified platform on which to plan.
In the US, inspecting grid transmission and distribution lines to identify anomalies has always been a process carried out to meet state guidelines. Inspection intervals are set by Public Utility Commissions across the US and tend to be every 1-2 years. As a result of these yearly time gaps, risks in the form of faults and outages can never be fully mitigated. Because of that, resolving anomalies in assets and systems typically only happens exactly at the same time as identification.
Inspection and Risk Mitigation software and services aim to mitigate these risks, by detecting anomalies in grid assets and systems before they cause faults, outages, and further damages. Through the combination of AI/ML, analytics, and data from monitoring systems (such as UAV / drones), Inspection and Risk Mitigation solutions provide utilities with a predictive intelligence layer.
This layer not only removes the need to deploy human field crews for inspection reducing operating costs, but increases utilities’ situational awareness of the grid. They are no longer reliant on inspection results that occur annually or bi-annually, but have real-time inspection assessments happening as often as every minute.
Most power grid assets are 50 to 70 years old. These aging assets contribute to losses in power transfer and are increasingly susceptible to faults and outages. What’s worse is that most of these assets haven’t been digitized, providing no visibility into real-time asset health and lifecycle status.
Assets are either 1) replaced only when faults and outages occur or 2) replaced without knowledge of the underlying health status of the asset. Replacement or maintenance services are often only initiated when the grid goes down (which by then is too late 😬). Knowing which assets and when to replace them is poorly understood.
Grid asset management software and services aim to equip operators / utilities with real-time data and insights over grid assets. This enables operators / utilities to better plan and optimize asset replacement cycles. Since not all assets can be replaced at the same time, such software improves planning and orchestration. Grid asset management software forms a real-time, “middleware” interface that determines the health status of assets relative to one another so operators / utilities can better plan replacement cycles.
The Northeast Blackout of 2003 and other blackouts caused by outages can be traced back to poor vegetation management. To remove the chance of these outages happening again, regulatory frameworks such as FERC’s FAC-003-4 Transmission Vegetation Management provide standards and requirements for utilities.
However, meeting standards for tree trimming and clearing transmission lines free from vegetation has been a costly and labor-intensive process. It involves deploying human field crews to assess vegetation levels on-the-ground.
Incident detection software and systems allow utilities better visibility on vegetation growth and broader climate risks so they can comply with regulation, and more importantly, reduce risk of outages and wildfires. Through satellite imagery, predictive analytics, and physical risk assessment, incident detection solutions offer real-time power grid monitoring.
These capabilities give utilities in the control room visibility over potential threats ahead of time at the ground-level, without needing to take a single step in the field. Mapping out physical threats that may put the grid at risk provides a singular digital interface that all utility team members can view. It means field crews are only deployed when necessary and to the most critical of events, removing the guesswork.
The grid is under pressure to deliver reliable electricity to end users. And this pressure is piling up specifically at the distribution level where utilities are facing unprecedented demand. Electrification, population growth, and increased DER participation complicates power flows, increases outage likelihoods, and increases customer interaction. Historically, these problems have been solved with one-dimensional solutions built to remediate a single problem. For example, faults are monitored through Fault location, isolation, and service restoration (FLISR) and outages are managed through Outage Management Systems (OMS).
But what if utilities could solve these problems through a single solution, instead of navigating multiple interfaces? Advanced Distribution Management Systems (ADMS) glues together fault detection, outage response, and customer interaction to provide utilities with one interface to manage distribution-level grid problems. Think of ADMS as a swiss army knife providing greater control for utilities to manage faults, outages, and end use demand through a fully integrated system. Utilities no longer have to deal with multiple isolated solutions on their own (like FLISR and OMS) but just have to interface with one integrative layer in the form of ADMS.
Meeting power demand is a delicate process and often has hiccups, especially when transmission lines get overloaded. Congestion prevents electricity from being delivered as forecasted. This materializes in congestion costs which are passed on to end users and have been on the rise, jumping 56% in the US in 2022.
Currently, operators alleviate congestion through power flow controls and switches. However, reconfiguring power flows through these hardware technologies takes time and is often reliant on human knowledge and experience. These calculations are manual and time-consuming. Topology Optimization software streamlines this process, remediating congestion through automated responses to congestion incidents.
Think of it as the car SatNav that searches for the most optimal route when there’s traffic. Instead of operators having to come up with reconfigurations or rerouting pathways manually, Topology Optimization software automates this process, analyzing, and evaluating possible ways to alleviate congestion. And giving operators a complete bird’s-eye view over what’s happening, when it’s happening at the transmission-level.
What happens when climate tech meets robotics
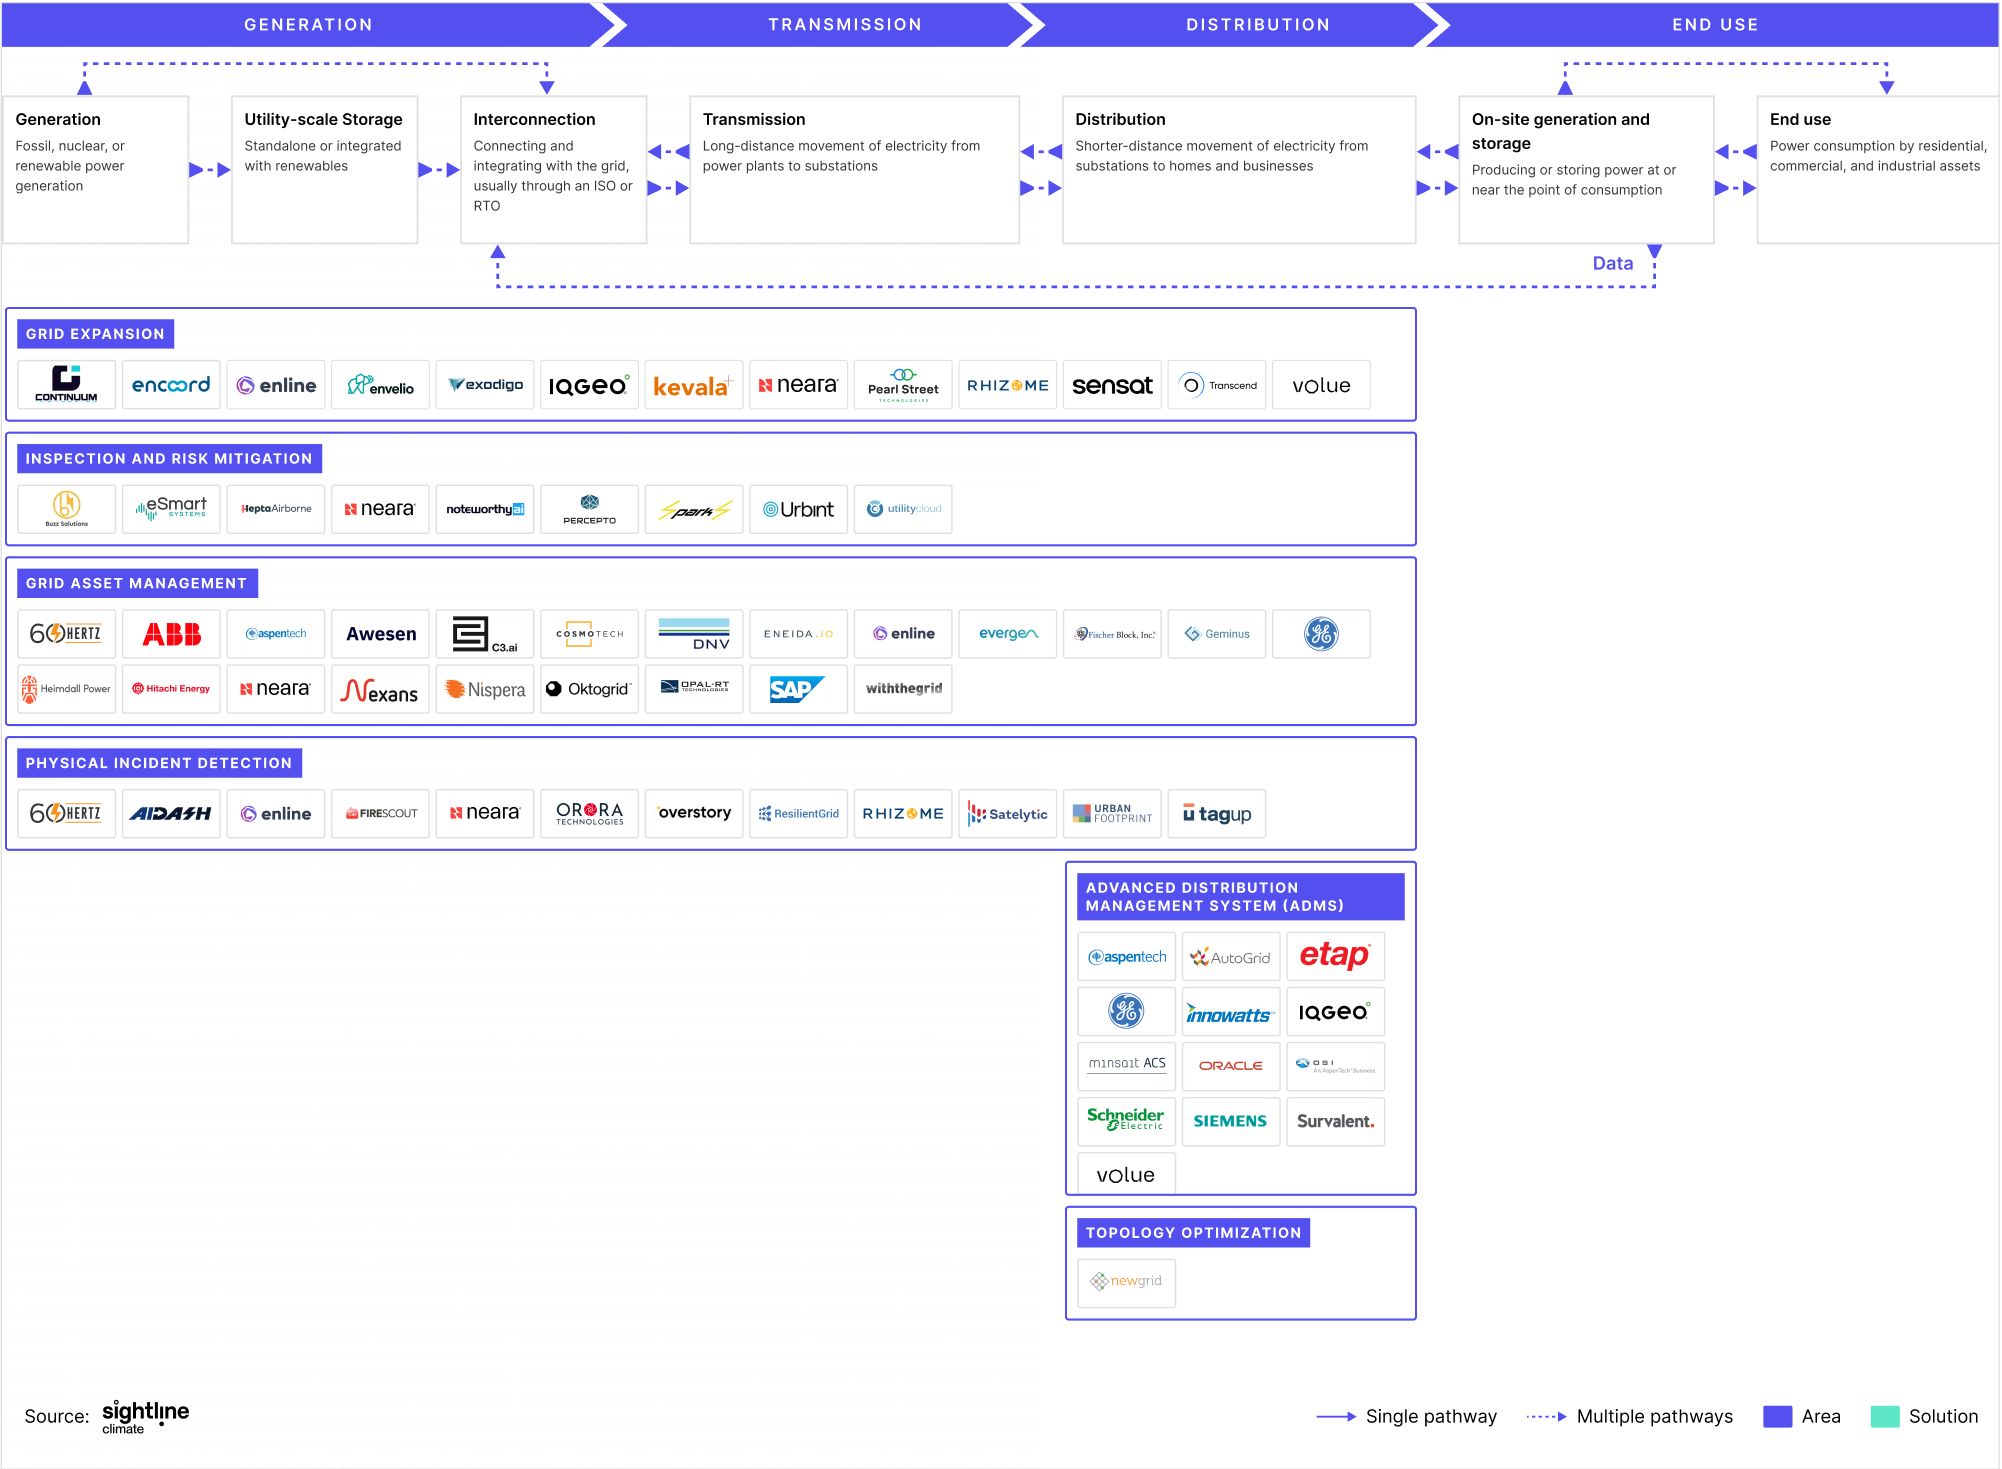
$90bn in climate dry powder in Q1 2026, after record fundraising in 2025
A breakdown of China’s new FYP and what it means for the next decade of the energy transition
 Newsletter